Data Summary (2015-2022)
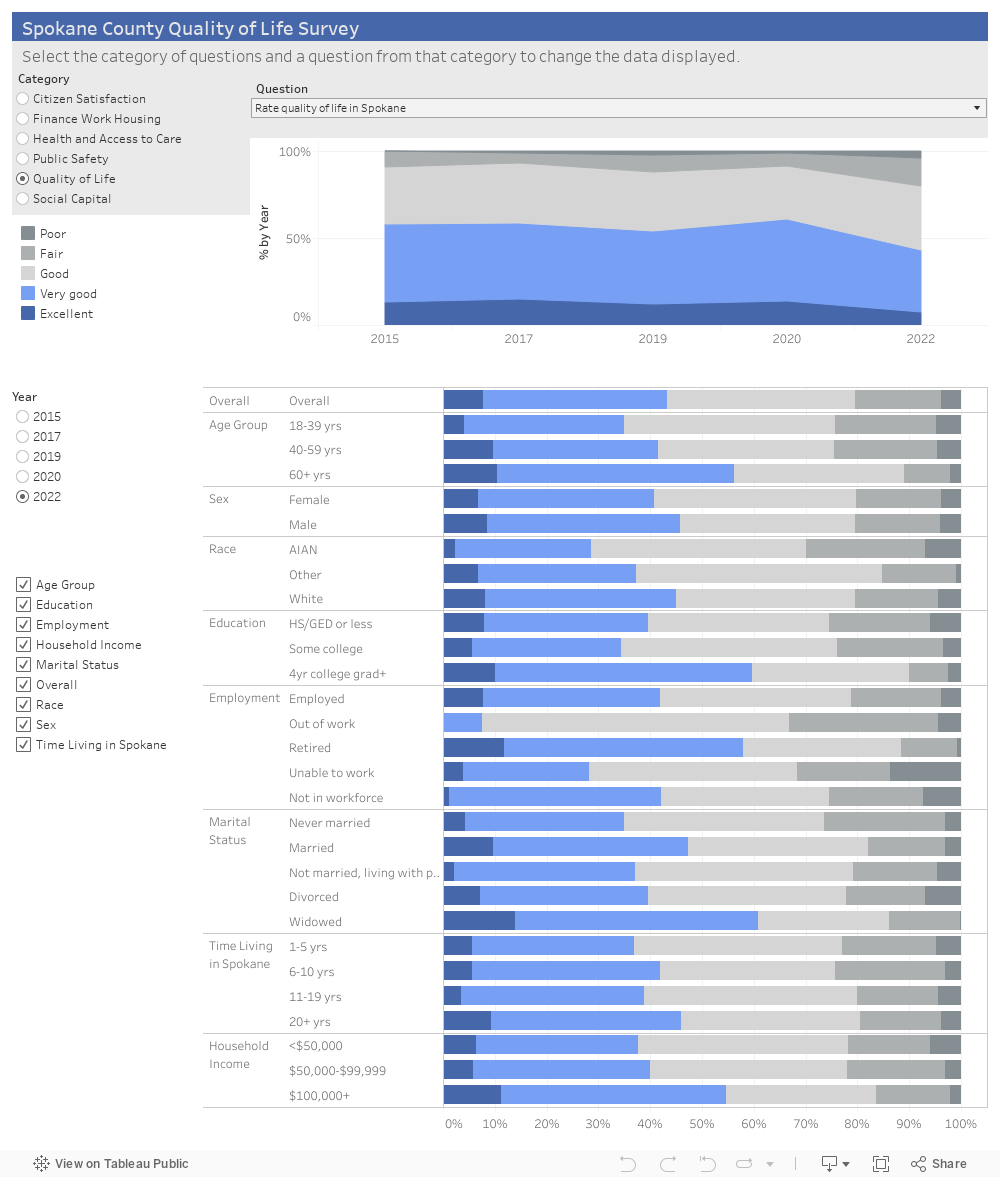
The results of the Quality of Life (QoL) Surveys from 2015 to 2022 are summarized in the visual below. The visual includes results for how respondents rated the overall quality of life in Spokane and how they rated five additional areas, referred to here as domains. The domains include citizen satisfaction, finance, health, public safety and social capital. Follow the steps below to filter the results for each domain. The overall results for Spokane County appear at the top of each graph and are followed by additional results organized by sociodemographic groups such as age, sex, and income.
Follow these steps to filter the QoL Survey results:
-
- Select one of the five Quality of Life Survey domains from the Category menu on the top left-hand side of the dashboard.
- Select an individual question within the domain, using the Question dropdown menu located on the top center of the dashboard. Note: When you select a new domain you will need to repeat this step and select a new question to see results.
- Select a QoL Survey year using the Year menu on the left side of the dashboard.
Data Notes: The stacked bars show the percentage distribution of responses for each item within Overall Spokane County residents and for breakdowns according to sociodemographic group.
Data Source: Spokane Regional Health District, Quality of Life Survey, Spokane County, 2015-2022.
To View The Full Tableau, Click Here